HyperStorylines: Interactively Untangling Dynamic Hypergraphs
Vanessa Peña-Araya1, Tong Xue1, Emmanuel Pietriga1, Laurent Amsaleg2, and Anastasia Bezerianos1
1Université Paris-Saclay, CNRS, Inria, LISN
2Inria. Univ Rennes, CNRS, IRISA
Information Visualization 2021
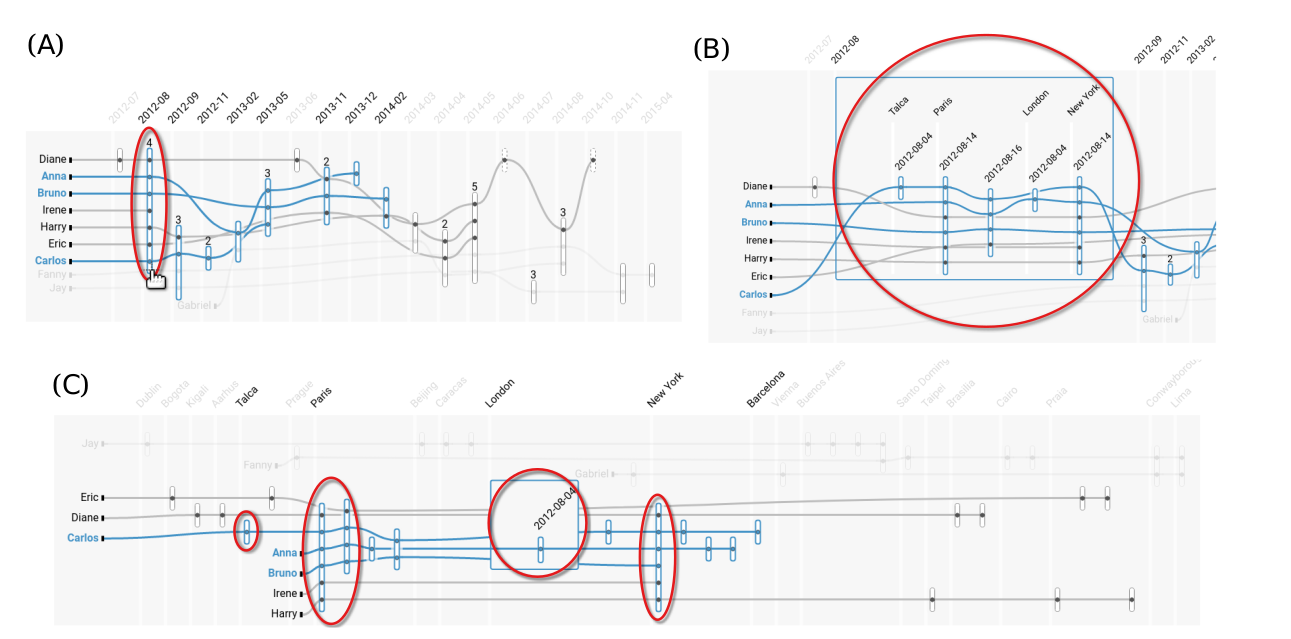
(A) Lines are the stories of entities of one type, in this case of the type people, that evolve along the horizontal axis, that here represents entities of a second type which is time (aggregated by months). Small vertical bars are constructed relationships, positioned in the intersection of both axes of the entities that compose them. In our case, these relationships represent entities that appeared in news articles. For example the relationship highlighted in red indicates all people that appeared in news articles in August 2012. Relationships can have zero or more internal nested entities (a third type of entity). These nested entities can be seen as a mini-story by interactively expanding the relationships (B). For example, here we see details in August 2012, including the nested location entities that tie people to places in the articles, and more precise date information. The type of entities on the horizontal axis, the vertical axis and the nested entities can be changed with selectors in our tool. For example, in (C) we can see the stories of people related by locations instead of time (time is the nested entity). The red circles across images indicate where the entities that contribute to the highlighted relationship in (A) appear in the other views.
Associated publication:
Software
Supplementary Material
The following items link to the files we used to conduct our research:
- Folder workshop slides:
- workshop-1.pdf: are the slides of the first workshop with data journalists of Ouest France
- workshop-2.pdf: are the slides of the second workshop with data journalists of Ouest France
- Folder study screenshots contains a set of screenshots of the web interface used for the comparative study for both visualizations (HyperStorylines and PAOHVis). They include the instructions, some questions and possible answers.
- Folder qualitative analysis and
questionnaires:
- user_finalpostquestionaire.csv constains the responses of the participants of their overall opinion for each visualizationfor each task.
- Strategies - Supp Material.xlsx summarizes the strategies used for each participant for each question for each visualization and task.
- Folder quantitative analysis contains all
the data
and analysis of our comparative study. More specifically:
- Data folder contains:
- user_answers_ms.csv: answers, self-perceived confidence and time taked for each trial for each user.
- user_interactions.csv: every interaction done by all participants while answering the questions.
- 1.- Data Wrangling:
- 1_aggregate_data.R loads the file that contains the answers (user_answers_ms.csv) and creates two files with the aggregated data, one for the training trials and one for the main ones.
- Data folder contains:
-
2.- All tasks
- 2-tasks_all_CI_TIME.R: computes Confidence Intervals (mean and difference between tools) for ERROR for both phases for all tasks collectively.
- 2-all_tasks_CI_TIME.R: computes Confidence Intervals (mean and difference between tools) for TIME for both phases for all tasks collectively
- 2-all_tasks_create_table_phases.R: Creates table with plots of Confidence Intervals for TIME, ERROR, and means for CONF and DIFF for all tasks and all phases
-
3.- Per task
- 3-tasks_separated_CI_ERROR.R: computes Confidence Intervals (mean and difference between tools) and plots for ERROR for both phases per task
- 3-tasks_separated_CI_TIME.R : computes Confidence Intervals (mean and difference between tools) and plots for TIME for both phases
- 3-per_task_create_table.R : Creates table with plots of Confidence Intervals for TIME, ERROR, and means for CONF and DIFF the results per task, per phase
-
4.- Learning per task
- 4-per_task_per_phase_TIME.R: computes Confidence Intervals for TIME for each phase for each vis.
- 4-per_task_per_phase_TIME_table.R: merge Confidence Intervals for TIME per phase for each vis in a table.
- 4-per_task_per_phase_ERROR.R: computes Confidence Intervals for ERROR for each phase for each vis.
- 4-per_task_per_phase_ERROR_table.R: erge Confidence Intervals for ERROR per phase for each vis in a table.
-
5. Learning all tasks collectively
- 5-all_tasks_learning_ERROR.R: computes Confidence Intervals for ERROR for all tasks collectively comparing between Exploratory and Advanced phase.
- 5-all_tasks_learning_TIME.R: computes Confidence Intervals for TIME for all tasks collectively comparing between Exploratory and Advanced phase
- 5-time_error_all_tasks_learning_table.R: creates a table with the results above
-
6.- Task complexity
- 6-per_task_per_complexity_CI.R: computes Confidence Intervals for TIME and ERROR for the 3 levels of tasks complexity and creates a table with all the results
-
7.- Screen size
- 7-screensize.R: script that contains a set of subscripts that generates 3 plots per phase: (i) means of all the metrics for all tasks collectively per participant, (ii) means of ERROR per task per participant and (iii) means of Completion Time per task per participant.