Geo-Storylines: Integrating Maps into Storyline Visualizations
Golina Hulstein1, Vanessa Peña-Araya2, and Anastasia Bezerianos2
1Université Paris-Saclay
2Université Paris-Saclay, CNRS, Inria
VIS 2022 - IEEE Visualization Conference
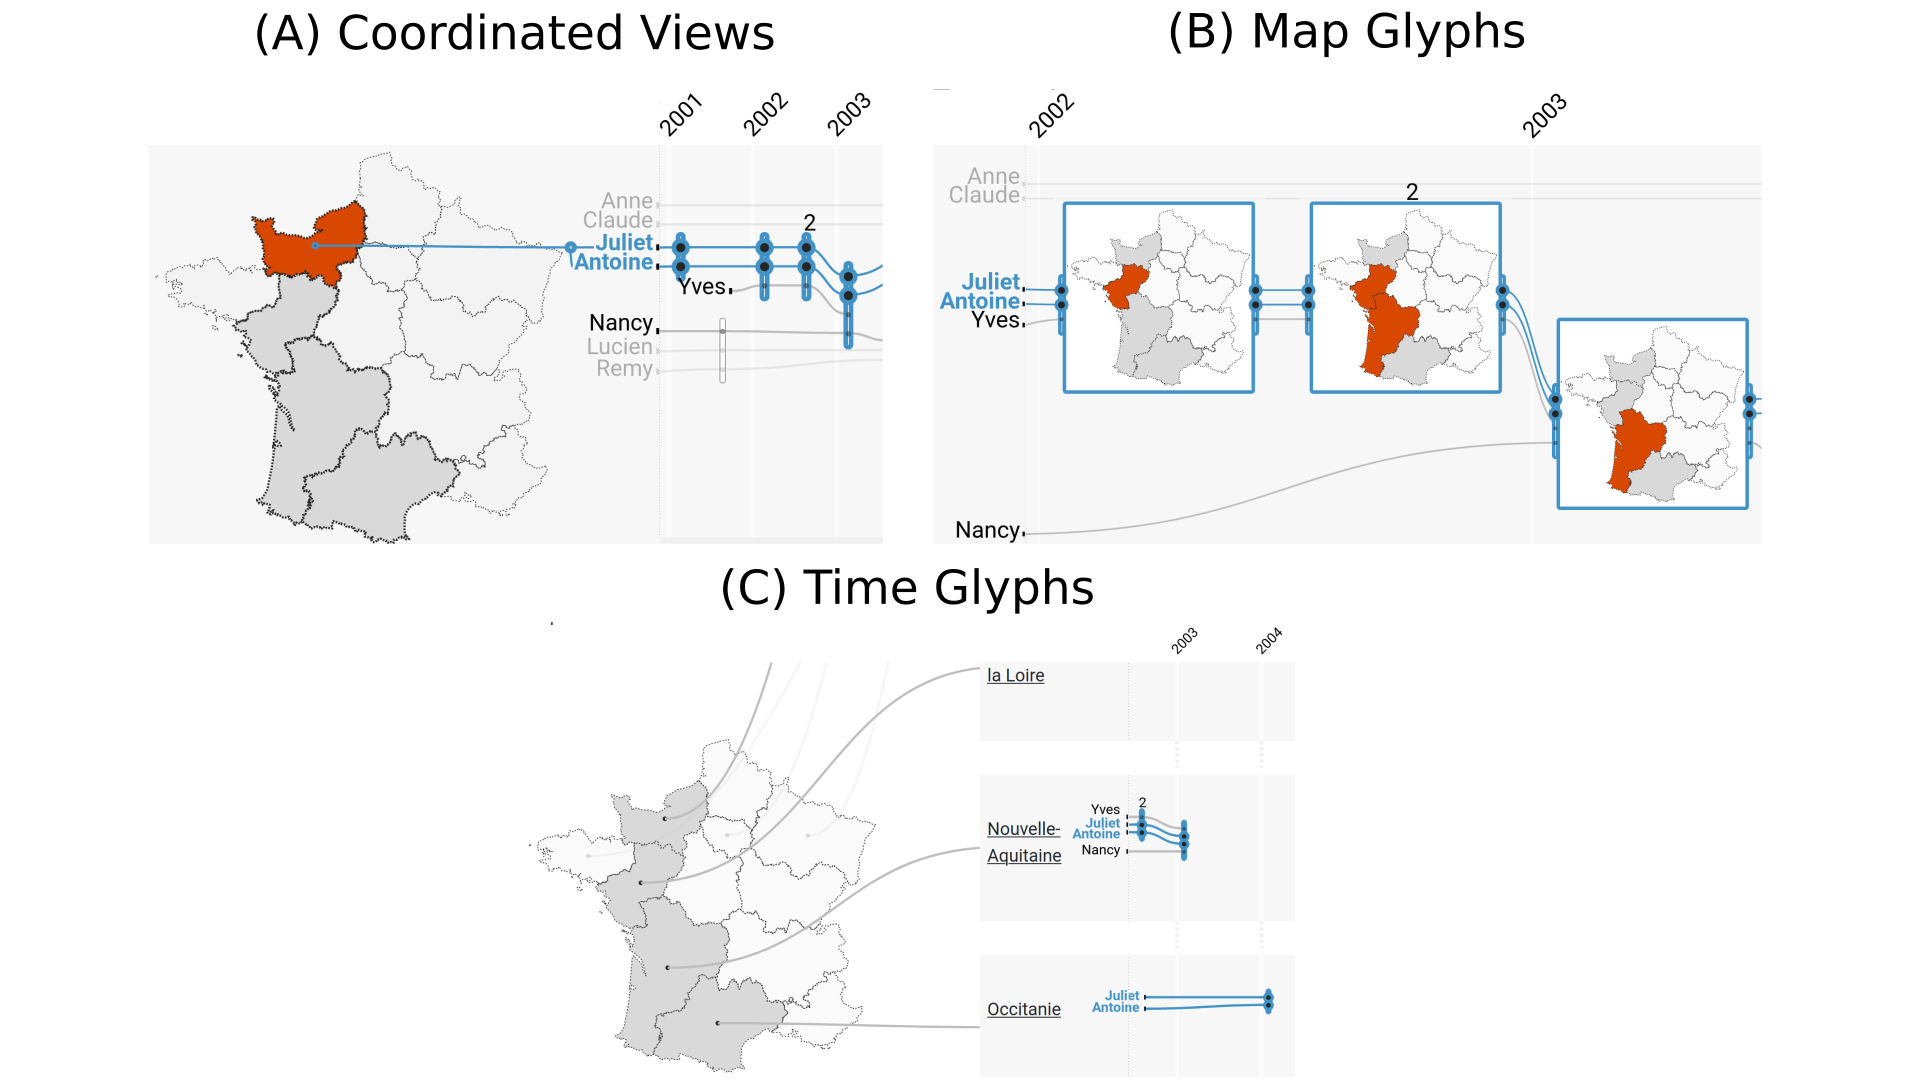
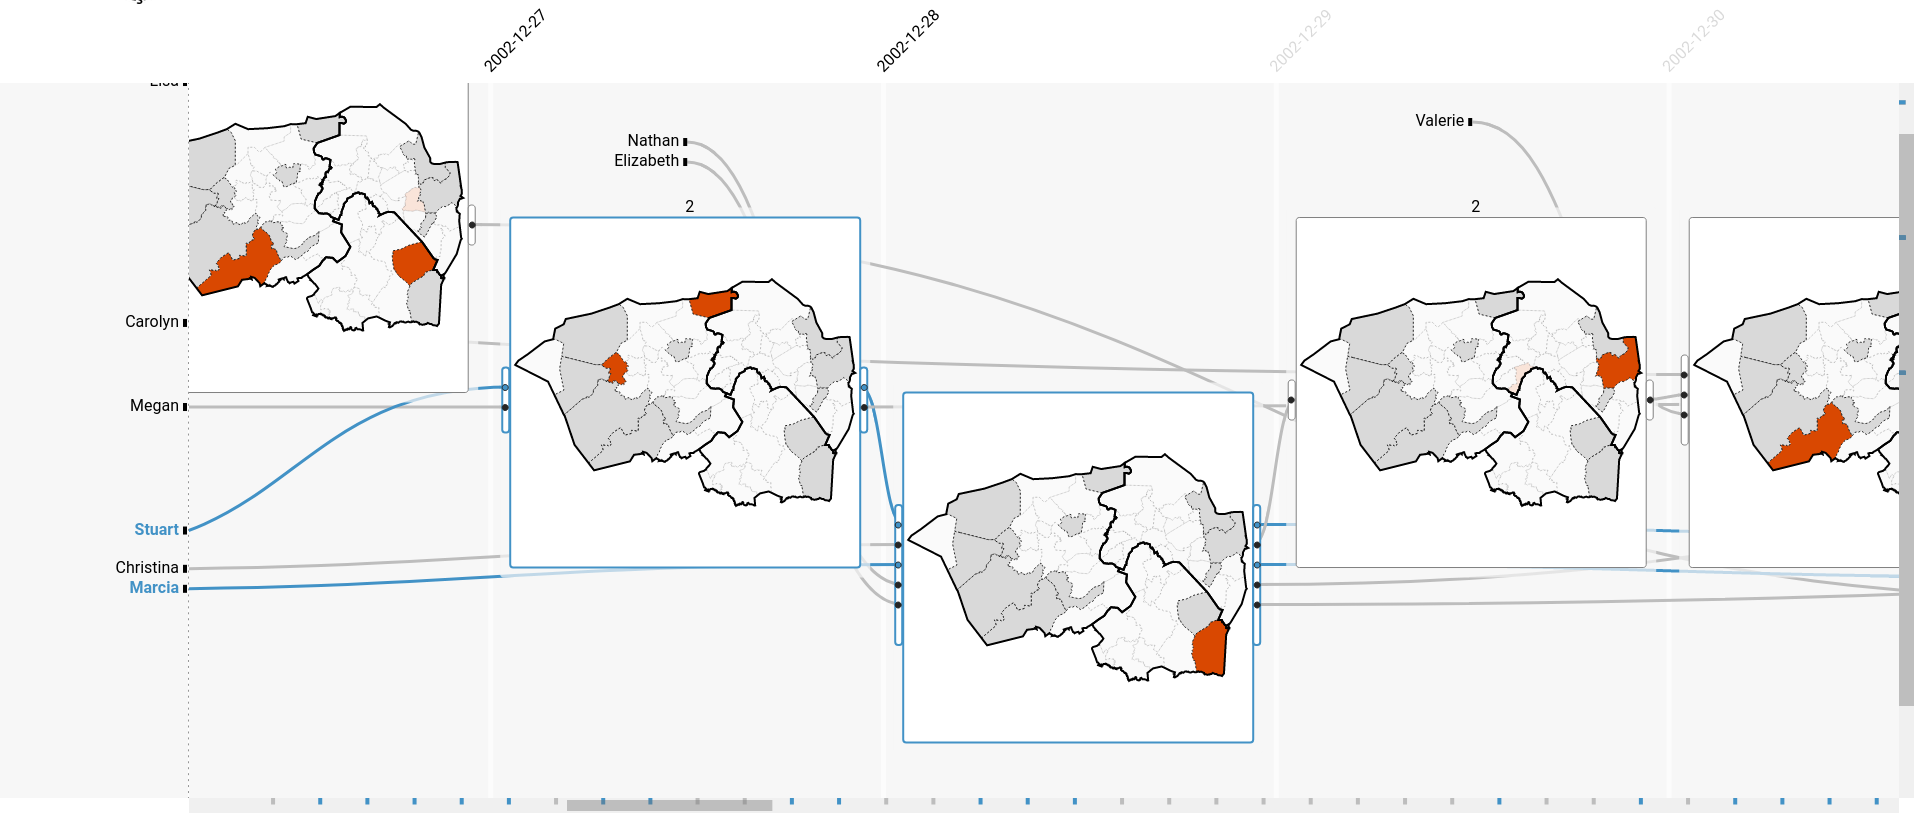
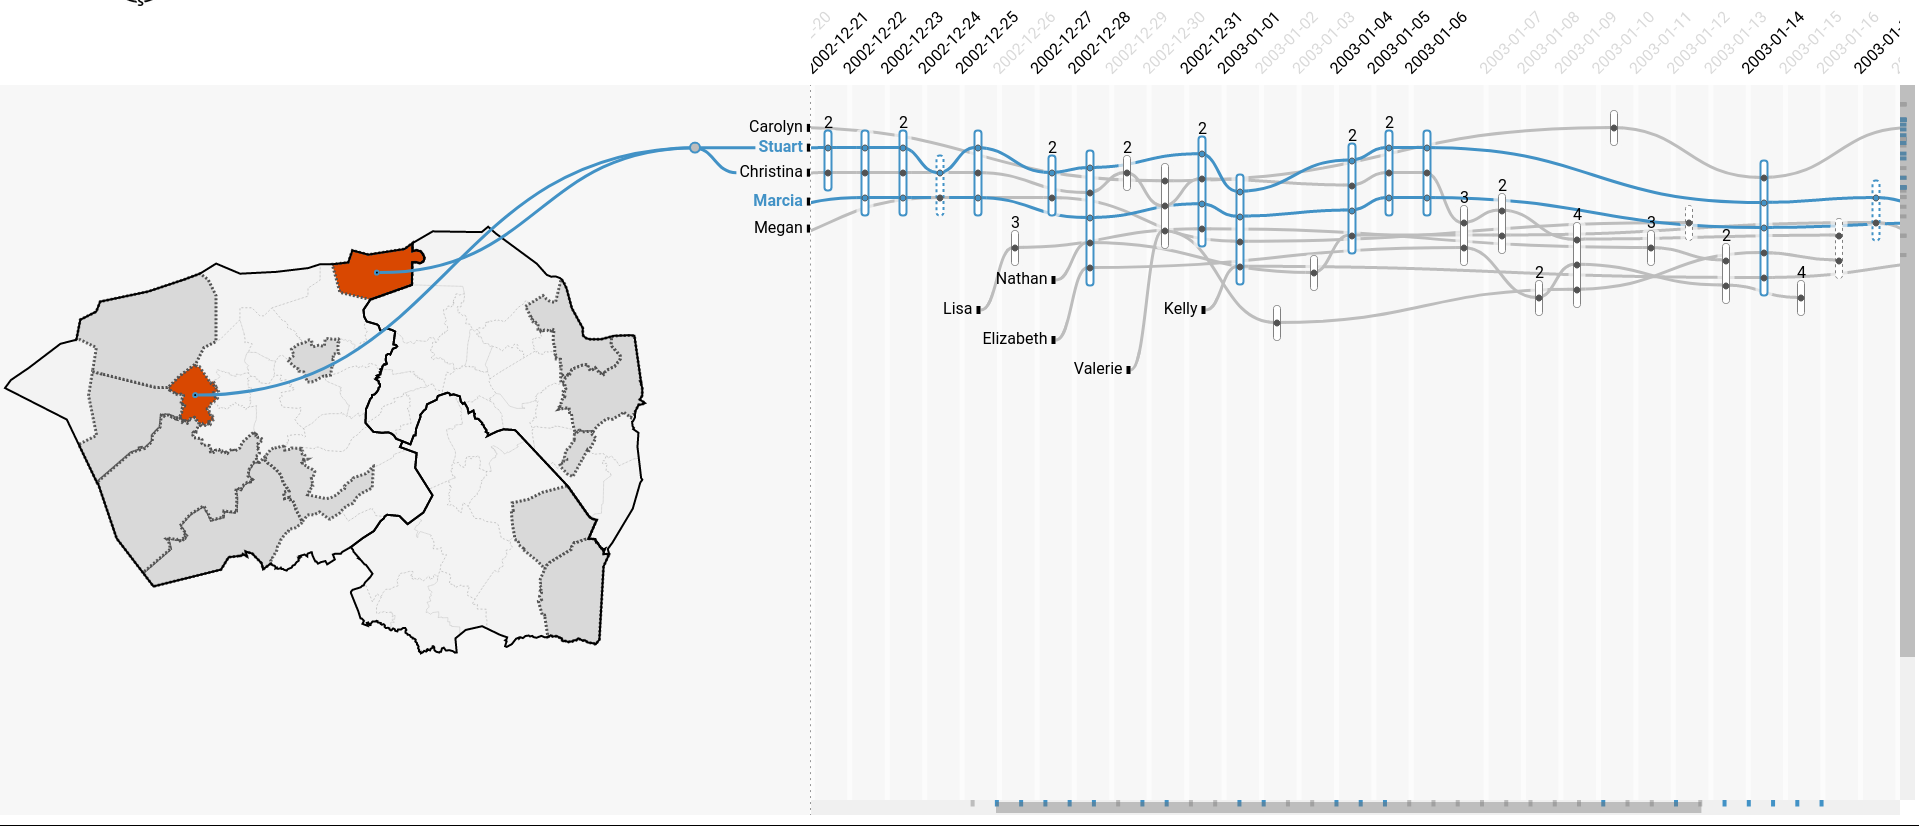
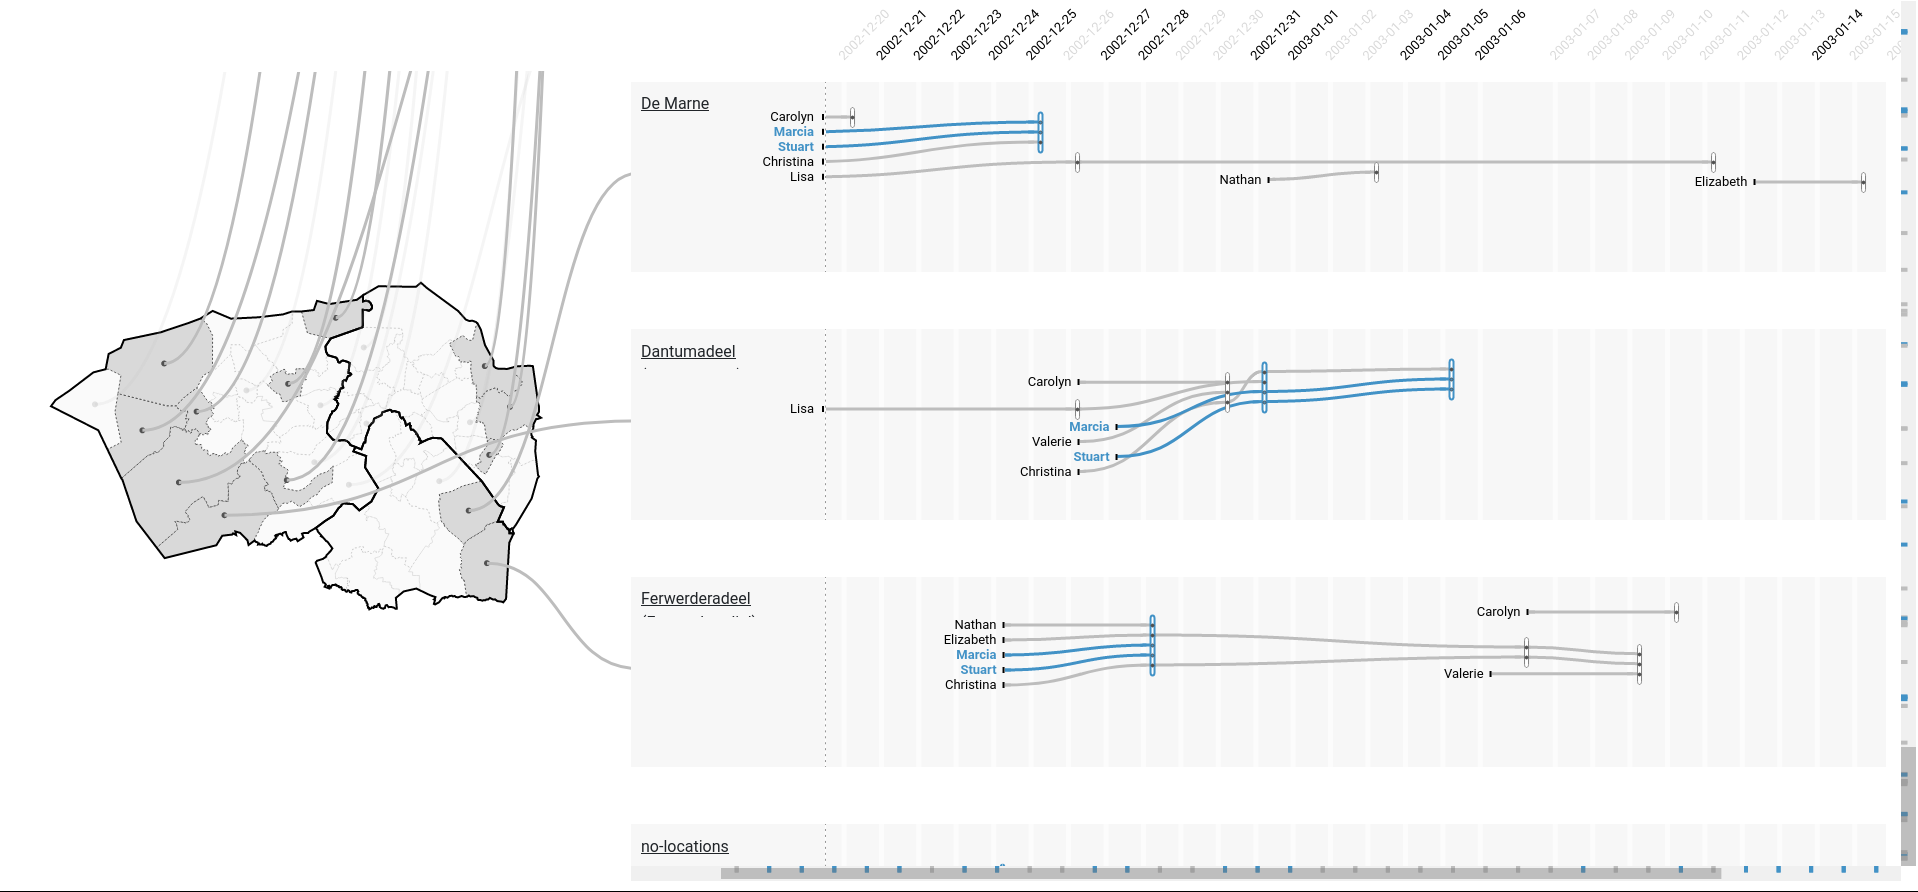
Three Geo-Storyline designs showing the geo-temporal evolution of the relationships between people. The two selected people in blue moved together from north to south. (A) Coordinated Views include a map on the left and a unique Storyline timeline on the right. While scrolling, links appear between the relationship nearest to the map and the associated locations. (B) In Map Glyphs each relationship is represented by a map with the associated locations drawn in orange. (C) Time Glyphs are composed by a map on the left and a scrollable list of Storyline glyphs on the right. Each Storyline glyph contains all the relationships associated with one location. Gray lines between a location on the map and a storyline glyph indicate the correspondence between the two.
Associated publication:
Software
Supplementary Material
The following items link to the files we used to conduct our research:
Tool video and screenshots
- Folder Tool Video and Screenshots.
- A video: video showing all techniques being used to conduct all 5 study tasks under a training map
- Static screenshots of all techniques of Map Glyphs, Coordinated Views and Time Glyphs.
- Folder Workshop Materials contains:
- Slides from the Workshop Introduction in the 1st session (including inspiration visualizations): wokshops_slides.pdf.
- Clustering Analysis description and all sketches: clustering_analysis.pdf
- Table with detailes on clustering iteration and re-analysis of sketches and related work based on the design space: design_space_coding.xlsx
- A document explaining the Miro boards for groups with an example: workshops_miro_boards.pdf
- All miro boards from all groups: under Miro-WorkshopSketches-Group{ 1, 2, 3, 4}
- Inspiration cards used in the 2nd seession: workshops_inspiration_cards.pdf
- Datasets used in the workshop, (i) their description: workshops_datasets.pdf; and (ii) the pre-fabricated datasets that we provided to participants: under the directory datasets/ . Please note that some participants used their own datasets not provided here.
- Folder Material from the user
study:
- Description of how spatial patterns were created on maps (including ones only used in the pilot): spatial_patterns_creation.pdf
- Detailed report of all CIs and images from all analysis: CIs_report.pdf
- Analysis scripts in R for our analysis and plot creation with a seperate readme file on how to run them: quantitative_analysis/
- Quanlitative analysis of participant questionnaires (comments and strategies): quanlitative_analysis/